Hello!
I am creating a Dash app that includes a map made using the following code:
def map(df):
    fig = px.scatter_mapbox(df, lat="Latitude", lon="Longitude", size="Log(TotalRevenue)",
                            color = "Log(TotalRevenue)",  color_continuous_scale=px.colors.sequential.YlOrRd,
                            zoom=2, size_max=10, hover_name='Location', animation_frame='Year',
                            category_orders={'Year':[2010, 2011, 2012, 2013, 2014, 2015, 2016]})

    fig.update_layout(margin=dict(l=15, r=15, t=10, b=10),
                      autosize=True)

    return fig
The map is embeded in the Dash app like so:
dcc.Graph(
            figure=map(df),
            style={'width':'55vw', 'height':'inherit'}
        )
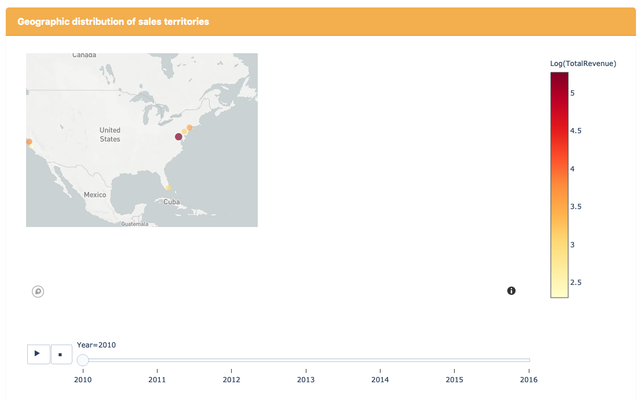
The strange thing is that on start-up of the app, the map almost always shows up in a smaller size.
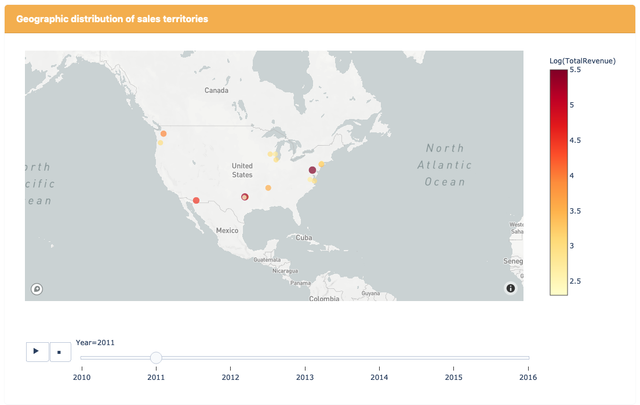
When I click on the animation button, the map then pops into the right size.
Is there a way to correct this?
Thank you very much!
Hello!
I am creating a Dash app that includes a map made using the following code:
The map is embeded in the Dash app like so:
The strange thing is that on start-up of the app, the map almost always shows up in a smaller size.
When I click on the animation button, the map then pops into the right size.
Is there a way to correct this?
Thank you very much!